Experts in multivariate data analysis, Ondalys participates in most conferences dedicated to Chemometrics, Machine Learning and infrared spectroscopy.
See below a panel of Ondalys scientific presentations in recent years
-
Advanced methods of Chemometrics / Machine Learning
- Explainable ML: Machine learning interpretability methods applied to spectroscopic data
- LC-HRMS data analysis using multiblock approach – Application to the reactivity of lignocellulosic biomass
- Exploratory analysis of 3D Fluorescence spectra of raw material and link to the process yield in Bioproduction
- SVM regression : an example for spectroscopic quantitative predictions
- Comparison of Machine Learning methods for spectroscopic data analysis
- Why and how using exploratory multi-block analysis ?
Advanced methods of Chemometrics and Machine Learning
Colloquium Chemiometricum Mediterraneum CCM2025
Explainable Machine Learning: Machine learning interpretability methods applied to spectroscopic data
Machine Learning (ML) models can often be described as “black boxes”.Iin order to have greater confidence in their results, it is necessary to improve their interpretability. That’s the so-called Explainable AI (Artificial Intelligence). This study is focused on the interpretability of Machine Learning models based on near-infrared spectroscopic data.
Different regression models such as Support Vector Machines (SVM), Artificial Neural Networks (ANN) and Extreme Gradient Boosting (XGBoost), have been trained and compared to the classical PLS calibration models.
Various ML model interpretability algorithms currently applied to non-spectroscopic data have been tested and compared: Local Interpretable Model-agnostic Explanations (LIME), Shapley Additive Explanations and pseudo-samples prediction . They have also been compared to the regression coefficients of an intrinsically interpretable Partial Least Squares model.
This study shows the potential for applying different Machine Learning model interpretability methods to Near Infrared spectroscopic data.
Chimiometrie 2024 conference
LC-HRMS data analysis using multiblock approach – Application to the reactivity of lignocellulosic biomass
3D LC-MS signals are massive and complex. Some commercial software allow to extract informative features, but need a lot of parameters to tune, leading to a rather black-box and non-reproducible method.
In this oral communication, Ondalys and IFPEN present their joint works aiming at classifying biomass samples using their LC-HRMS signal, according to their level of enzymatic reactivity and identify biomarkers that are responsible of low-level enzymatic reactivity
The original proposed approach is to consider LC-HRMS data as two separate data blocks (LC and MS), and compare performances on single blocks to a multiblock analysis. By investigating discriminant coefficients, relevant biomarkers can thus be identified in both dimensions and help for interpretation.
Chimiometrie 2022 conference
Exploratory analysis of 3D Fluorescence spectra of raw material and link to the process yield in Bioproduction
Raw materials used in cell fermentation can be complex and cell culture process conditions are highly controlled in biopharmaceutical manufacturing. Thus, the raw material lot-to-lot variability can therefore have a high impact on the yield of the vaccine antigen production processes.
The combination of 3D fluorescence spectroscopy and chemometrics and machine learning methods like principal component analysis (PCA), parallel factor analysis (PARAFAC) or partial least squares (PLS) and multilinear PLS (N-PLS) modeling has been commonly used as a tool for the identification or classification of raw materials.
In this oral communication, we present our joint work with GlaxoSmithKline which led to the development of a 3D fluorescence method which can be used to characterize a complex raw material and, ultimately, predict the yield of antigens based on the quality of the batch of raw materials.
After the optimization of the pretreatments used to improve the intra-batch reproducibility and inter-batch separation, and the selection of the more important variables by knowledge from the PARAFAC loadings, the optimal PLS model seems to be very promising.
Chimiometrie 2019 conference
Some aspects of SVM regression : an example for spectroscopic quantitative predictions
In the Chemometrics community, “Machine Learning” (ML) techniques are becoming more and more widespread, together with the “Artificial Intelligence” (AI) and “Big Data” hype trends. But how to apply those AI/ML techniques in the most suitable way to the lab data and especially to spectroscopic data is still a challenge.
In a previous study in 2018, we compared several Chemometrics and Machine Learning methods: Linear PLS modeling, X-variable transformation – PLS to cope with non-linearity, Local Modeling (Locally Weighted Regression – LWR), Random Forest (RF), Support Vector Machines (SVM) and Artificial Neural Networks (ANN) on Near-Infrared (NIR) spectroscopic data. We proved that ML techniques can significantly improve the quantitative model performance for non-linear modeling relationships.
In this study, we will focus particularly on Support Vector Machines (SVM), since they show several advantages: they are able to model non-linear relationships, with rather good performances over linear methods, but require fewer samples and less optimization burden than ANN.
GFSV days – 2018
Comparison of Machine Learning methods for spectroscopic data analysis
For spectroscopic data analysis, the terms “multivariate data analysis” or “Chemometrics” are most often used. Since a few years, with the advent of “Big Data” and other “IoT – Internet of Things”, the terms “Machine learning” and “Artificial Intelligence (AI)” have been used more and more. But what is Machine Learning?
Through a real user case of near infrared (NIR) spectroscopy, this presentation aims at presenting and comparing different Machine Learning methods allowing to model a non-linear parameter: the fat content in meat, i.e.
- Variables transformation and PLS models
- Local models (Locally Weighted Regression – LWR)
- CART / Random Forests (RF)
- Support Vector Machines (SVM)
- Artificial Neuronal Networks (ANN)
Presentation in French
Chimiometrie 2013 conference
Why and how using exploratory multi-block analysis? A global view of the objectives and results
Multivariate data is now abundant to characterize products and processes. More and more users (academic and industry) deal with several data tables or blocks for the same observations or samples. Several analytical techniques or sensors are used at the same time to characterize samples.
Chemometrics tools are thus used to combine the different data tables to extract the best information to make decisions. Different strategies are possible to explore a set of data tables. The most simple and intuitive idea is to concatenate or merge data and perform a PCA using an appropriate weighting strategy. Other methods have been developed to take into account within the algorithm the fact that data comes from different tables and to estimate the relationship between the tables. For example, Qannari and al. developed the Common Component and Specific Weight Analysis (CCSWA) and Wold et al. worked on the Hierarchical PCA (HPCA). Some authors are trying now to unify the theory and explain the links between all these methods.
The present work comes from the implementation of the workshop called ‘Multi-block analysis for combining different kinds of spectroscopic data tables’ held during the pre-conference courses of the NIR2013 conference in La Grande Motte, France. We tried to show in a didactic way, as a tutorial, the key issues addressed to the end-user for multi-block analysis used in exploratory applications. The different steps and pitfalls are illustrated using a real data table set collected on virgin olive oils coming from different regions.
Calibration, transfer et robustness
20th HelioSPIR days
Model optimization, maintenance and transfer between NIR spectrometer and micro-spectrometer: Application to the assessment of the Ente plum maturity.
This study carried out jointly by the french technical center of plum (BIP) and Ondalys aims at replacing the lab reference methods by a rapid and non-destructive method such as near infrared spectroscopy (ASD LabSpec4®) and possibly by a portable tool used directly at the orchard (MicroNIRTM OnSite®).
The experiments were carried out by the B.I.P. and the data analysis by Ondalys. They consisted of :
- Perform a feasibility study of the measurement of sugar and acidity by near infrared spectroscopy
- Build robust prediction models on a spectrometer at the laboratory
- Improve the model optimization and maintenance over vintages
- Databases and models transfer to a portable micro-spectrometer
Presentation in French
ICNIRS2017
Orthogonalization method for robustness improvement of on-line NIR applications.
Online model maintenance is one of the main problems when developing Near Infrared Spectroscopy (NIRS) applications. Perturbation appearance due to environmental changes, maintenance operation or aging of the instrument often affects the model performances.
Model corrections with classical methods such as bias and slope or model redevelopment are not always satisfactory.
The use of an orthogonalization method can be a very effective way to solve this problem; this approach is illustrated in this study with an industrial application
Chimiometrie 2011 Congress
Calibration transfer in a complex case –
Application for a discrimination model of the aromatic potential of wine
So far, oenologists do not have any fast tools to steer the harvested grapes according to their aromatic potential towards a specific winemaking process.
This project was carried out with the French Wine and Vine Institute (IFV). It aims at modeling the qualitative potential of a vineyard plot by relating data from Mid-Infrared spectra measured on grapes before harvest to the final quality of the wine.
The objective was to build a model to discriminate the mid-infrared spectra and a sensory classification with 2 classes (Fruity/ Vegetal) over several vintages.
The problems occurred for this calibration transfer in a real case within the framework of a discrimination model will be detailed. A focus will be especially made on the importance of the choice of the method transfer (DS, PDS, TOP / EPO, local centering, etc.) and the choice of samples for the standardization set.
Presentation in French
Process control
Analyse Industrielle 2018 Show
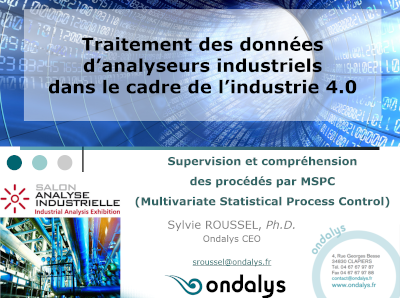
Supervision and process understanding using MSPC (Multivariate Statistical Process Control)
The PAT (Process Analytical Technology) initiative encourages all manufacturers, especially in the pharmaceutical industry to control their production processes. In this context, an increasing number of sensors are used in-line, on-line or at-line to control the production.
The data measured with these sensors must be compiled and analyzed, in order to carry out the process supervision in globality. Thus this monitoring can be performed using multivariate methods such as MSPC (Multivariate Statistical Process Control) for continuous production processes or BSPC (Batch Statistical Process Control) for batch processes. These methods optimize and supervise the production processes. They also provide in a diagnosis of drift causes, taking into account all the process parameters.
Presentation in French
AgroStat 2016 congress
Batch Statistical Process Control (BSPC) : a powerful multi-level risk & process analytics tool
The Food and Drug Administration (FDA) initiative in the USA recommended in 2004 the implementation of Process Analytical Technology (PAT) in the pharmaceutical industry, in order to improve the risk analysis and process control.
Ten years after, PAT has been developed, tested and implemented in numerous R&D and industrial sites all over the world.
The first part of this presentation gives details on PAT goals and implementation. The second part focuses on one important field of application of PAT with high added value, i.e. batch monitoring or Batch Statistical Process Control (BSPC) using multivariate data analysis.
NIR 2013 conference
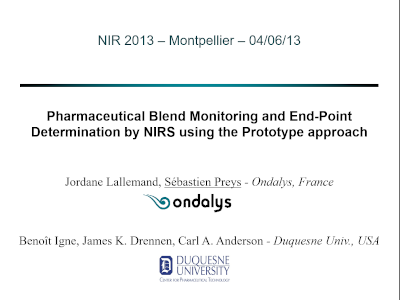
Pharmaceutical blend monitoring and end-point determination by NIRS using the Prototype approach
Sampling followed by quantitative assay is progressively replaced by PAT technologies such as NIR spectroscopy for blend homogeneity determination (Sanchez, 1995; El-Hagrasy, 2006; Shi, 2008; Igne, 2011).
Due to the various sources of process variability impacting the process trajectory, none of the blends will reach homogeneity at the same time. Some qualitative methods (Maesschalck, 1998; Sekulic, 1998; Puchert, 2011), e.g. PCA, SIMCA, and quantitative methods (Berntsson, 2002), e.g. PLS, associated with specific statistics have already been applied to help determine when a blending operation should be terminated. This study proposes to use a qualitative method called Prototype using innovative statistics for end-point determination.
Discrimination
Chimiometrie 2017 conference
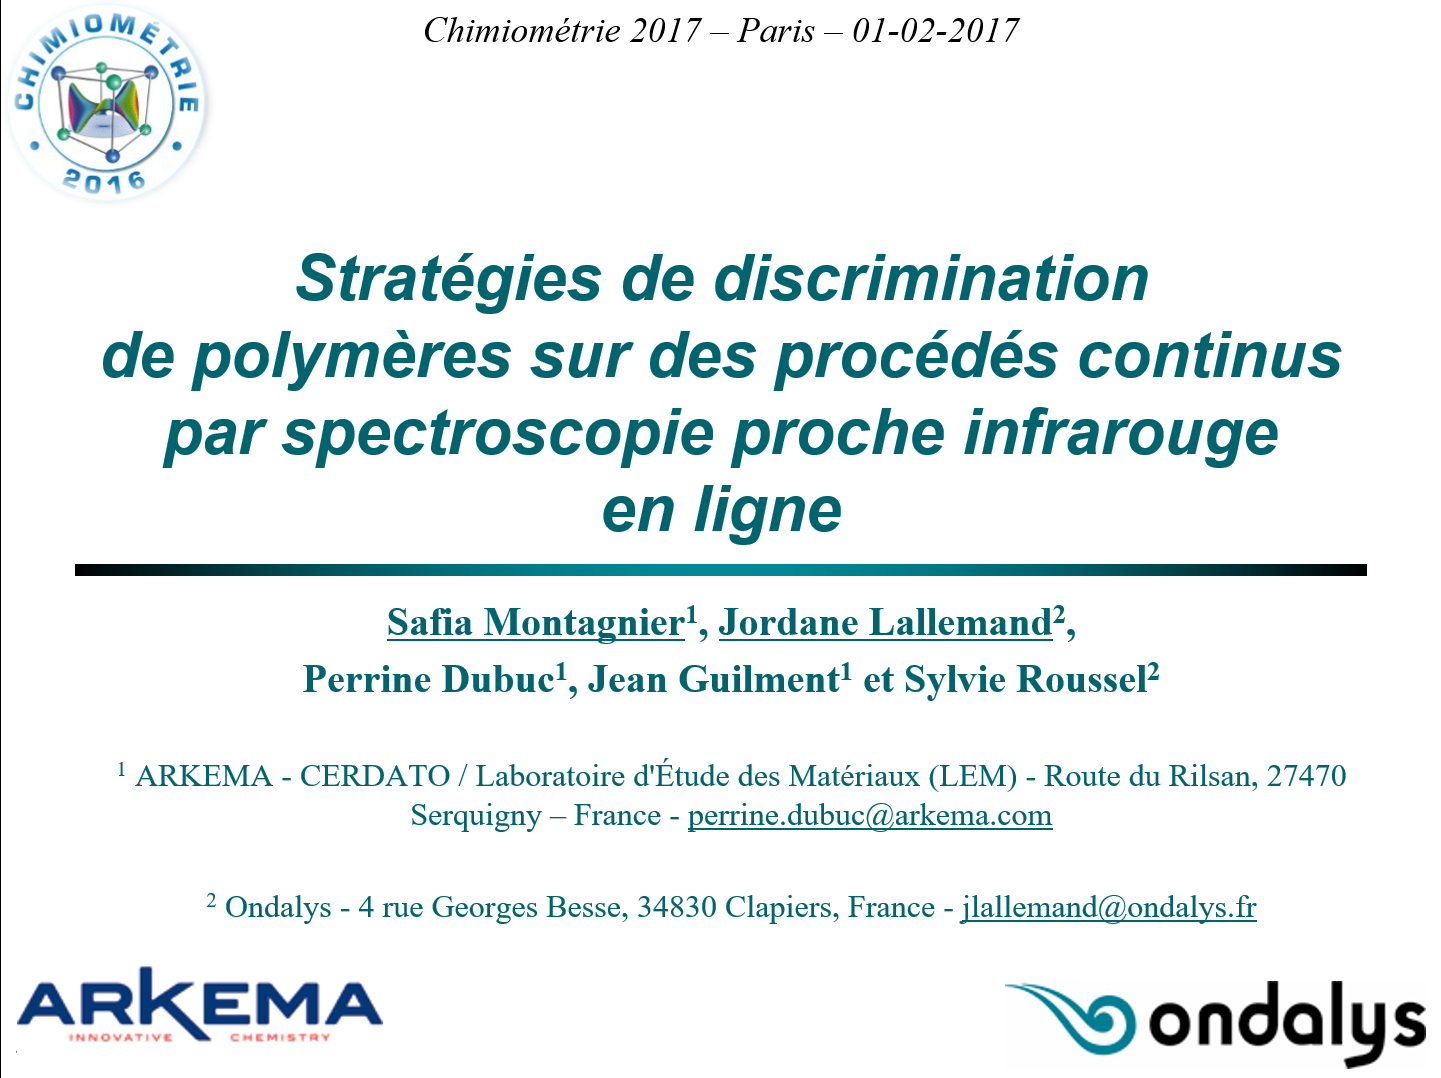
Strategies of polymer discrimination on continuous processes using NIR spectroscopy in-line
The methods based on vibrational spectroscopy, and more specifically the near infrared (NIR), allow to obtain fast and accurate results at-line or on-line. We can thus replace heavy techniques in terms of maintenance, dangerousness or sample preparation. A NIR spectrum can be directly measured without any preparation on a collected sample or directly on-line.
During the continuous process control, the difficulty but also the interest of on-line NIR analysis is to follow the transition from a product A to a product B, in order to control the conformity of these products.
For polymers, the transitions may be due to a change in the composition (% of comonomer X relative to Y, addition or deletion of a comonomer). It also can be the result of a change in the polymerization rate. Comprehensive models for the quantitative prediction of polymer properties allow to obtain values throughout the process; however, in most cases, these models are not acurrate enough. It is therefore important to determine which product the NIR analyzer is facing in order to choose the specific quantitative model of the product and thus predict the end of the transition and the transition to a stabilized state.
This article aims to assess various polymers discrimination strategies based on NIR spectra during transitions in order to choose the appropriate quantitative methods for online polymerization monitoring.
Presentation in French
HelioSPIR 2014 Meeting days
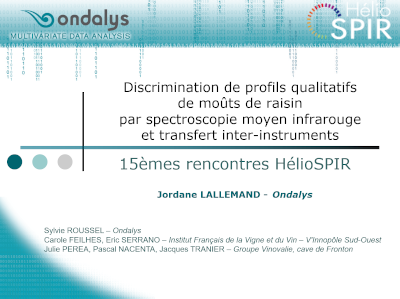
Discrimination of qualitative profiles of grape must using mid-infrared spectroscopy and inter-instrument transfer
Currently, oenologists do not have fast tools to guide the grapes at harvest according to their aromatic potential towards a specific winemaking process. The project carried out with the French Institute of Vine and Wine (IFV) aimed to model the qualitative potential of a vineyard plot by linking mid-infrared spectra measured on grapes before harvest and the wine quality.
This study makes it possible to tackle the problem of discrimination and calibration transfer in mid-infrared spectroscopy in a complex framework, with the following constraints:
- Characterization of an aromatic potential using mid-infrared spectra
- Discrimination model based on a sensory reference measurement
- Calibration transfer between spectrometers (various equipment manufacturers of spectrometers, network of same spectrometers between cooperative cellars and laboratories, management of maintenance operations / breakdowns)
- Availability of standardization samples
- Representativeness of sampling
- Vintage variability
The objective is to establish a discrimination model based on mid-infrared spectra and a sensory classification with 2 classes (Fruity / Vegetal) over several vintages.
The problem of the calibration transfer, within the framework of a discrimination model, is detailed, in particular the importance choosing the transfer method (DS, PDS, TOP / EPO, local centering …) and the standardization sample set.
This work was carried out as part of a collaborative FUI research project called VINNEO, funded by the French state, the Occitanie Region (ex Languedoc-Roussillon), BPI France and the European FEDER Fund, in collaboration with the teams of Vinovalie, a wine cooperative cellars in the South-West.
Presentation in French
Our training sessions
Ondalys proposes in-house training sessions for industrial and academic scientifics.
Our expertise to make sense of your data
With more than 15 years of experience in data analysis, chemometrics and machine learning, especially applicated to spectroscopic data, our team helps you in each step of your project.
You need a tailor-made training ?
Our team study your request to offer you the most suitable and personalized training.

